As Posted in mybudget360
“Definition of economic bubble: A market phenomenon characterized by surges in asset prices to levels significantly above the fundamental value of that asset.” We are definitely in another housing bubble. First, most Americans can’t afford to buy a home without utilizing artificially low interest rates and even then they are stretching their budgets like spandex. Second, home prices are surging in the face of stagnant household incomes. That is the biggest sign of a bubble. The underlying asset in housing is moving up even though incomes are not. So what is driving prices up? Speculation, flipping, investors, and what we would categorize as fickle money. This is the ultimate sign of a housing bubble. Homeownership is near a generational low because most households are living month to month unable to buy. If you want to see the housing bubble in one chart look no further.
The scariest chart in housing
Home prices are up a stunning 34 percent from 2012. That is an incredible increase but this is not being driven by families buying homes. It would also be different if household incomes were going up. They are not. Take a look at this chart:
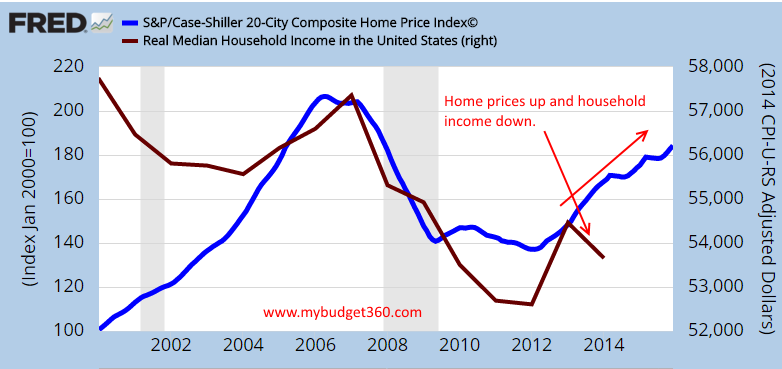
This might even be scarier than the years before the last bubble. Why? Take a look at the chart. From 2002 to 2008 housing prices and incomes went up together (but of course home values were already on an upward trajectory). The bubble hit and both home values and incomes went down. All of this makes sense. In 2012 housing prices and incomes went up. But that jump in income only lasted a brief period. Now, you have home prices surging 34 percent yet incomes are stagnant. That is a big problem.
You can even see this problem between new home prices and new homes sold:
New home sales are in the dumps yet prices are moving up dramatically. Most of this is speculation and of course the financial sector in our economy is thriving on the backs of the middle class. But are we in a bubble?
“Bubbles are often hard to detect in real time because there is disagreement over the fundamental value of the asset.”
This is where we stand today. We are in the bubble. It is hard to assess value because people are disagreeing on whether this is a bubble or not. But take a look at commercial real estate values as well. This is definitely a bubble. You need to continue to have speculative money flowing in to keep values at their current levels.
Will the housing bubble pop this year? Bubbles can last longer than most people think. But there are already cracks in the system. You saw the market briefly correcting this year. Suddenly stocks are up on low volume and current prices are still overvalued. The same can be said for housing. Low supply, low demand, yet prices are going up. The Fed is completely afraid to raise rates knowing that it has no other option but to keep rates low. This policy move has made the middle class a minority.
Here is a good summary of where we are going:
“(The Sovereign Investor) I see one of two scenarios at play. Which one do you think will ring true?
- Homebuyers continue to fork over more dollars to buy properties while we sit with stagnant wage growth, stagnant economic growth and low-wage jobs being about all that’s created.
- We are on the edge of a bubble larger than the one we experienced less than a decade ago as housing prices race back down to where it is affordable and sees demand from new buyers.
The Federal Reserve is held accountable for this fiasco. If it goes forward with a rate increase in the near future, it will be us who pay the price of another bubble.
There’s only one action to take if you ask me — lower your exposure to the industry.
In stocks, that’s homebuilders and mortgage originators. Avoid them at all costs. In your personal investments, that’s being prepared for another real estate shock.
These prices are unsustainable and due for a correction.
Once that happens, opportunity awaits you to pick up houses and housing-related stocks on the cheap.”
You have been warned.
If the above is true, and we believe it is, seller financed notes should be purchase at no greater that a 70% Loan to value or no greater than 65% investment to value
Capstone Capital USA