With real estate being so competitive, may investors are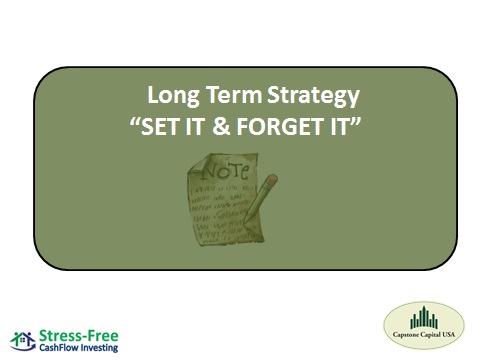
investigating real estate mortgages.
This short video explains the variables.. WATCH HERE
Real Estate Note Buyers and Seller Carry Consultants
With real estate being so competitive, may investors are
investigating real estate mortgages.
This short video explains the variables.. WATCH HERE
Pending home sales rose in December for the third straight month, providing further evidence that 2017 was a positive year for housing, but the National Association of Realtors doesn’t expect the good times to keep rolling.
Recent data from NAR, the Census Bureau and the Department of Housing and Urban Development showed that 2017 was the best year for new home sales and existing home sales in a decade.
Now, new data from NAR shows that pending home sales rose in December to the highest level since March 2017, but NAR is concerned that Republican-led tax reform will dent home sales in 2018.
According to a new report from NAR, which was released Wednesday, the Pending Home Sales Index, a forward-looking indicator based on contract signings, increased 0.5% to 110.1 in December from an upwardly revised 109.6 in November.
That marks the third straight month that the index has increased.
But combine continually low housing inventory and the Republican tax plan, which President Donald Trump signed into law late last year, and you have a recipe for a slowdown, according to NAR Chief Economist Lawrence Yun.
“Another month of modest increases in contract activity is evidence that the housing market has a small trace of momentum at the start of 2018. Jobs are plentiful, wages are finally climbing and the prospect of higher mortgage rates are perhaps encouraging more aspiring buyers to begin their search now,” Yun said.
“Sadly, these positive indicators may not lead to a stronger sales pace,” Yun added. “Buyers throughout the country continue to be hamstrung by record low supply levels that are pushing up prices – especially at the lower end of the market.”
According to NAR, there’s an “imbalance” of supply and demand, which has led to price increases of 5% or more for each of the last six years, but Yun expects that to slow this year.
Yun said that while tight inventories are still expected to put upward pressure on prices in most areas this year, he expects overall price growth to shrink, with some states even experiencing a decline, due to the negative effect the changes to the mortgage interest deduction and state and local deductions under the new tax law.
“In the short term, the larger paychecks most households will see from the tax cuts may give prospective buyers the ability to save for a larger down payment this year, and the healthy labor economy and job market will continue to boost demand,” Yun said. “However, there’s no doubt the nation’s most expensive markets with high property taxes are going to be adversely impacted by the tax law.”
Three of the states where the tax bill’s changes to property tax deductions are expected to have a significant impact are already threatening to sue the government over the tax bill.
Last week, the governors of New York, New Jersey, and Connecticut said they plan to sue the government due to the Tax Cuts and Jobs Act’s elimination of certain state and local tax deductions.
The tax bill installs a cap of $10,000 on state and local tax deductions, but several states (including New York, New Jersey, and Connecticut) have state and local tax burdens that far exceed $10,000.
Yun said that he anticipates the changes to the SALT deduction rules to disproportionally impact certain segments of the housing market.
“Just how severe is still uncertain, but with homeownership now less incentivized in the tax code, sellers in the upper end of the market may have to adjust their price expectations if they want to trade down or move to less expensive areas,” Yun said. “This could in turn lead to both a decrease in sales and home values.”
Topic

INVESTMENT GOALS & EXPECTATIONS
Our February Note Investors Forum Meeting will followup
on Stan Harley’s presentation– Taking what he shared and incorporating that with with YOUR individual goals. What is most important to you? Cash Flow or Capital Accumulation.
Or……………And more specifically how does risk tolerance fit into your needs and expectations. 
We’ll consider Performing and Non-Performing notes
How note due diligence can expand your expectations.
Case studies with 2 special out of state note investors
Click Here for more information
February 6th
Dobson Ranch Inn Fiesta Bar & Grill
1644 S. Dobson Rd
Mesa, AZ
SW Corner of Dobson & RT 60 – Superstition Freeway
Today an IRA administrator questioned -requested an explanation on the sale of a partial. He said he had never seen this type of transaction before. Neither had his compliance officer.
They were confused and requested a simple explanation which follows.
All of the following statements are true:
“Bob” is buying 3 partials–funding the last purchase of 125 payments(blue) for $18,900.
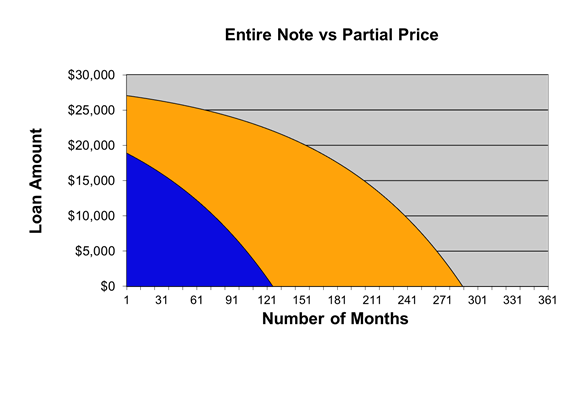
My entity is keeping the remaining payments –gold(the tail).My entity is assigning all the payments to him as evidenced by an allonge which keeps this transaction SEC compliant.
This is a great deal for Bob, because I will always be in the deal protecting the remaining payments(gold).
After Bob receives his payments, the remaining payments will be reconveyed to my entity as evidenced by a Reconveyance of Agreement for Deed which references the Purchase and Sale Agreement.
In the event of an early payoff, default or if Bob opts to exercise the 60 month buy back provision the following chart –the Entitlement Schedule –Schedule B illustrates how that scenario will be administered.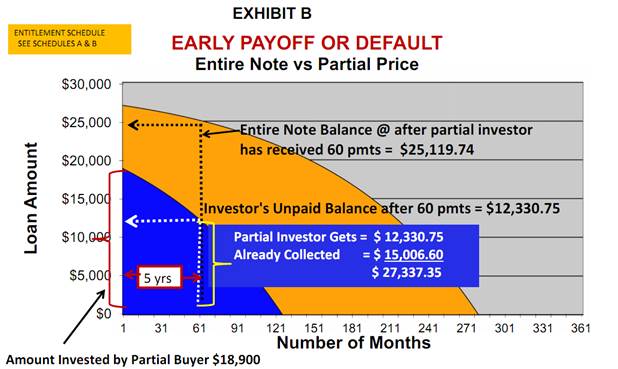
![]()
The IRA Administrator has executed the following docs:
Bob will record the Assignment of Contract for Deed to protect himself and will have the original note and the allonge(transfers the note) which will be archived by the Servicier and distribute the 125 payments to Bob. In the event of an early payoff or if the purchaser wants to exercise his 60 month option for an early buyback, his administrator as a road map for future reference.
The IRA company rep understood this transaction when explained in plain English. Additionally he received the following Partial from our NoteHolder’s Handbook–Note Holders Handbook_Partials.
A partial is one of the safest ways to invest in notes.
The IRA Administrator thanked me for providing a “Great explanation!”
 If a person wants to become a homeowner but lacks the qualifications to qualify for a traditional mortgage, signing a land contract is another option for purchasing property.
A land contract is a written agreement between the seller of the property and a potential buyer. Instead of taking out a mortgage and making payments to a bank, the buyer makes payments to the seller. But the seller retains ownership of the property until the buyer pays the entire purchase price. The land contract is essentially a type of rent-to-own agreement.
People can use land contracts to buy or sell any type of property, including personal residences, commercial buildings and land. There are several common situations where a buyer and a seller might use a land contract instead of going through the conventional mortgage process:
A land contract provides quite a bit of leeway when it comes to the conditions of the sale. Some of the items that the buyer and seller have to agree on include:
Sellers may allow buyers to make regular payments on property over a certain period of time, or they can demand a balloon payment after a specified amount of time. For example, the contract might state that the buyer has to pay off the entire sale price within five years. During the five years, the buyer could take steps to improve his credit and secure approval for a conventional mortgage.
On average, it takes 65 days for a home to sell. If the seller doesn’t want to wait this long or fears that a bank may turn down a mortgage for the property, the seller can opt to sell it with a land contract. Lenders may not agree to a mortgage for a property that requires extensive repairs or doesn’t meet other criteria. The seller has the option of selling it through a land contract instead of making the improvements or repairs.
Real estate markets constantly fluctuate; in a down market, the seller can often get more money for the property by offering a land contract. Buyers are typically willing to pay a higher overall price in exchange for seller financing.
A land contract has disadvantages for both the buyer and the seller.
A buyer who purchases a home with a traditional mortgage accumulates equity as he makes payments. He also gets to take advantage of gains in the housing market that raise the value of the house. Should the buyer decide to sell the property before the mortgage is paid off, the buyer still gets to realize the equity in the home.
However, if the buyer uses a land contract and decides he doesn’t want to remain in the home, he has no equity, even though he has made payments, a down payment and the home has risen in value.
It’s important to note that the courts consider the buyer an equitable titleholder to the property. This means that the buyer has an interest in the property, which prevents the seller from completing any actions that disrupt the buyer’s potential claim to the property.
A seller in a land contract has to assume the risk of a mortgage lender. There’s always the possibility that the buyer may not make the agreed-upon monthly payments. This is one reason that buyers usually pay more for property bought with a land contract.
The seller can file a land contract forfeiture in court that basically evicts the buyer and terminates the buyer’s interest in the property, but this option takes time. However, the seller gets to keep all payments made by the buyer and retains ownership of the property.
 Proper and detailed due diligence is a must in purchasing a quality note. The note overview provided for each note in the note vault is a summary of what our underwriting has determined to be important points to consider when purchasing note. Let’s look at them line by line.
TYPE–means the type of security. It could be a land contract, mortgage or deed of trust
CFD — means Land Contract, Contract for Deed or Agreement for Deed all of which are synonymous.
VALUE–is the value we have determined usually by a BPO(broker price opinion), sometimes referred to as a CMA(Competitive Market Analysis)
CURRENT BALANCE–is the current loan balance some times referred to as UPB–unpaid principle balance
ORIGINAL BALANCE–is the original when the loan was originated
P & I–meant the amount of the monthly principle and interest payment
ORIGINAL TERM–reflects the # of months of amortization when the loan was originated.
REMAINING TERM–reflects the # of remaining months of amortization.
PAYMENTS FOR SALE–reflects if we are selling all of the note or a piece of the note, meaning a Partial which is further described in this article and in paragraph 4 HERE.
INVESTMENT TO VALUE–reflects the amount of money invested divided by the property value or BPO amount. We consider a good range to not exceed 65%.
LOAN TO VALUE–reflects the amount of the existing loan balance(UPB) divided by the property value or BPO amount. We feel the lower the better, definitely less than 60-65%. The lower the better. The lower the better the equity position in the event something goes wrong with the payments.
INTEREST RATE-is the amount of interest the payor(borrower) is paying.
EFFECTIVE YIELD-is what is your rate of return based upon how much one is paying for the loan compared to the actual remaining loan balance.
SEASONING-reflects how many months the borrower has been paying since the loan was originated.
PAYMENT HISTORY-is a record–a spreadsheet of the payments which include due date, paid date, late fees, taxes and insurance payments and multiple other items. As long as the borrower is current 11 out of 12 months, it is considered to be a good history. As long as the borrower pays within 30 days of the due date even though there may be a late fee charged, we consider that to be on time payments.
ACH-means the payments are automatic bank drafts from the borrowers account. As lenders we really like that typo of borrower.
PAYOR—another word for borrower
DODD-FRANK FRIENDLY–refers to the Dodd-Frank Act which was effective January 10, 2014. Any loans originated after that date require underwriting by a loan originator.
PROJECTED RENT–reflects what that typo home rents for in the area. We use that as a benchmark for the payor–meaning we like to see their total payments to be less than a typical area rental. They have to live somewhere. If rents in the area are much more than their monthly PITI, it is less likely the payor will default.
For additional information on due diligence go to this posting.
Go to our NOTE VAULT for our current performing note inventory.
In todays’ world, many investors are in sort of a “conundrum”. Many are sitting on a pile of cash.
They continually ask themselves, what can I do?
Where can I invest?
What is safe and secure with a respectable/acceptable return?
You may fit one of these scenarios. What are you going to do?
Maybe it’s time for a mindset reset.
We play in an inefficient market.
Cash is no longer king.
Deals are KING!!
Think of a parked car in your yard. Is it getting rusty? Are the tires are going flat? Most likely the hoses and belts are rotting and the interior is mice infested?
Dry cash is the same thing. Inflation is devaluing what you have worked hard to acquire.
It may be helpful to do a short review of your needs a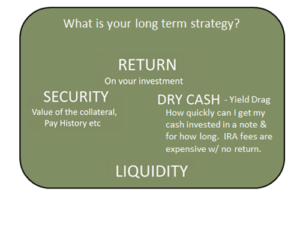 nd wants.
Consider this illustration.
Think about what is important to you.
Number them in the order of importance
that meets your needs.
There are other options!!
Consider Performing Real Estate Notes.
A properly vetted Performing note provides a quantifiable predictable rate of return on an investment backed by real estate. Passive mail box money.
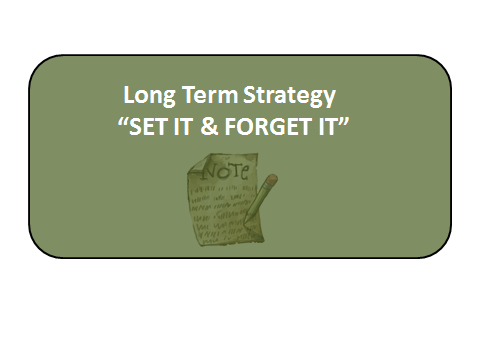
They can be a perfect match for your ROTH IRA or HSA.
Performing notes can provide a
“SET IT AND FORGET STRATEGY”
Every investor needs passive income in their portfolio.
Check out our NOTE VAULT for some options…
https://capstonecapitalusa.com/notes-for-sale/
G. Edward Griffin explains how inflation results from the Federal Reserve’s money printing scheme and that inflation is a hidden tax.
Here is an explanation of the two phase of inflation:
1. New money is created out of nothing by the Federal Reserve and is then loaned out to the federal government. The new money inflates the money supply. The government uses that money to pay employees, to finance wars, to fund welfare, to pay off cronies, and more. The favored political class gets the money first, when it has full purchasing power.
2. The second phase of inflation takes place when the politically favored groups spend the money with individuals who then take their money to their commercial banks and deposit it. This is where the real action happens.
The banks themselves create money, usually at a rate of at least 9 to 1 – for every one dollar deposited, the banks can create an additional $9. There is a massive expansion of the money supply.
The banks loan that money into existence and people borrow the money and spend it. Over time, the money trickles down to the common man.
More money equates to demand- with more money, more people are able to demand things. While demand increases, the supply of the goods and services does not increase. The expansion of demand, with only a limited supply of goods, results in higher prices.
When the money supply is expanded faster than the expansion of goods and services, it results in higher prices. Prices appear to go up, but the reality is that the value of the dollar is going down.
https://needtoknow.news/2017/06/2067/
Advanced Technical Analysis of the Financial Markets
This past Thursday I had the distinct pleasure of spending 4 hours with Stan Harley, the publisher of The Harley Market Letter.![]() He shared some interesting insights in two canary in the mine real estate markets – Los Angeles and Phoenix and further detailed what can be expected for interest rates in the future. What was astonishing to me is just how powerful market cycles are and how they can be used to hedge one’s bets and to be proactive and not just reactive. Many of the seasoned real estate investors understand there are cycles to all business activity, but few understand simple analysis can be utilized to avoid game changing and unexpected shifts in the market place. Mr. Harley believes that even external events really have no bearing on the math.
He shared some interesting insights in two canary in the mine real estate markets – Los Angeles and Phoenix and further detailed what can be expected for interest rates in the future. What was astonishing to me is just how powerful market cycles are and how they can be used to hedge one’s bets and to be proactive and not just reactive. Many of the seasoned real estate investors understand there are cycles to all business activity, but few understand simple analysis can be utilized to avoid game changing and unexpected shifts in the market place. Mr. Harley believes that even external events really have no bearing on the math.
Most business strategists and real estate professionals failed to identify  the key pivotal turns for the housing market in 2006 and 2012. Market timing – as most are well-aware – is an extraordinarily difficult task. The foundation which underlies the basic principles of his analytical methodology is that market behavior can be described (and predicted) through a combination of simple cycles of differing periods. Cycles are the essential factor in determining how long a trend should run and when to expect reversals.
“The knowledge and exploitatin of cycles embodies one of the most powerful analytical tools available for identifying trends and forecasting their reversale.” Stan Harley
CASE-SHILLER HOME PRICE INDEX
The Case-Shiller home price index tracks the value of residential real estate in 20  metropolitan regions across the United States. There are multiple Case-Shiller home price indices: A national home price index, a 20-city composite index, a 10-city composite index, and twenty individual metro area indices. The index is published on the last Tuesday of each month, with a two-month lag. The graph above depicts home price data from 1890 through the present. The lower graph reflects data for the Phoenix, AZ area region through Q3 2016.
Data for the Phoenix region is somewhat limited compared to the national data as well as data for the southern California region. Because the economies of Arizona and Southern California are inextricialby linked – and the cyclical funcitons for both etch-out similar wave forms – a detailed analysis of the Los Angeles region can tell us alot about the market timing functions for the Phoenix area region . A cyclical analysis of the Los Angelia area region, the largest in the United States, is depicted below. Data for Phoenix and the rest of the country are very similiar.
(Editors note: I forwarded slides from the local AZ Real Estate Investors March market presentation(some of which were from the Cromford Report). Mr. Harley was not surprised they matched up.)
COMPOSITES ARE BACK TO THEIR WINTER OF 2007 LEVELS
Editors Comment–The Canary is in the coal mine.
HOME PRICES ARE PEAKING
Since his last review of the Case Shiller index Mr Harvey has revised his cyclical modeling to the numbers shown in the box above. The baseline cycle appears to be 196.8 months or 16.4 years. Notice how this cyclical function defined the June 1990 – Sept 2006 peaks and the March 1996 – February 2012 lows.
The analysis points to a peak for the Los Angeles area – as well as the National Index overall – in the December 2016 time period. Because of the two month lag in the publishing of the data, we won’t know whether home prices have peaked for several more months. He also noted a narrowing in the range of the monthly price bars – a phenomenon that also occurred at the prior cyclical highs. However, based on the updaded data from the AZREIA slides for the period ending February, 2017, the trend is esclating.
At this point Stan Harvey is predicting a minimal drop of 12% in housing prices.
The Harry Dent team is suggesting a drop of 20% in housing prices.
Personally, I have noticed Days on Market are increasing. One of the local reps of a national title company here in Phoenix suggested they have seen a dramatic slowing in pricing for homes in central Phoenix.
Another title company rep noted their March has been VERY slow. A sales rep from a large local lender said their applications for March are way down.
Long term, Mr. Harley is predicting the big one in February, 2023
INTEREST RATES
Mr. Harley made one basic statement on interest rates. They will come down. Period.
HOW DOES THIS IMPACT NOTE BUYERS?
For note buyers keep your powder dry. Only buy notes with a strong equity position behind them. Another words be patient, and buy notes with a loan to value of less than 70%, preferrably less than 65% – all of which is subjective to mitigating factors. If one maintains that cardinal principal, then even with a potential property value drop of 20%, the chances of a payor walking are minimal.
HOW DOES THIS IMPACT NOTE SELLERS?
Make sure you get at a minimum of 10% down, preferrable 15% – 20% down from your buyer. Continue to require at least an 8% interest rate on your note from your buyer–preferrable 10%, but stay in line with the Dodd-Frank Act requirements. There are multiple posts regarding The Dodd-Frank Act on this site.
HOW DOES THIS IMPACT IRA INVESTORS?
It is all positive. Be conservative and positive. If market interest rates drop as forecasted, seller financed notes continue to be a rewarding investment alternative.
PS–It is all about being proactive and NOT reactive. Alot of money can be made in a down cycle–more than in an up cycle.
The Consumer Financial Protection Bureau is likely to be reigned in if not rendered i mpotent or even abolished under President Trump. He has said he would come “close to dismantling” it along with Dodd-Frank. That is good news for small business, consumers, the economy in general — and note investors.
The CFPB is the brainchild of super-liberal Massachusetts Sen. Elizabeth “Pocahontas” Warren, who never met a business she doesn’t want to regulate.
“At stake is the agency’s aggressive approach to regulating credit and prepaid cards, mortgages, payday and student loans, debt collection, credit reporting and other areas of consumer finance since opening for business in 2011.”