Real Estate Note Buyers

Real Estate Note Buyers and Seller Carry Consultants

  • Home
    • About
      • About Our Company
      • Client Testimonials
      • About Dave Franecki
      • Contact Us
  • NOTE | PROPERTY VAULT
  • NOTE INVESTING
    • Why Invest In Performing Notes OR Partials?
    • Buying Non-Peforming Notes
    • Reperforming Real Estate Notes
  • Get a Quick Note Quote
  • Seller Carry | Consulting
    • Seller Carry Consulting
    • Real Estate Brokers
    • Property Owners
    • FAQ
    • Videos
    • Contact us for Consultation
  • FREE INFO
    • Free Downloads
    • How to purchase land
    • TIPS – HOW TO SELL MY NOTE
      • How to Sell your mortgage note
      • Learn the value of your mortgage note
      • PROTECT YOUR MORTGAGE WITH
    • BLOG
You are here: Home / AZREIA / Metro Phoenix Real Estate Overview

Metro Phoenix Real Estate Overview

October 23, 2019 By Dave Franecki

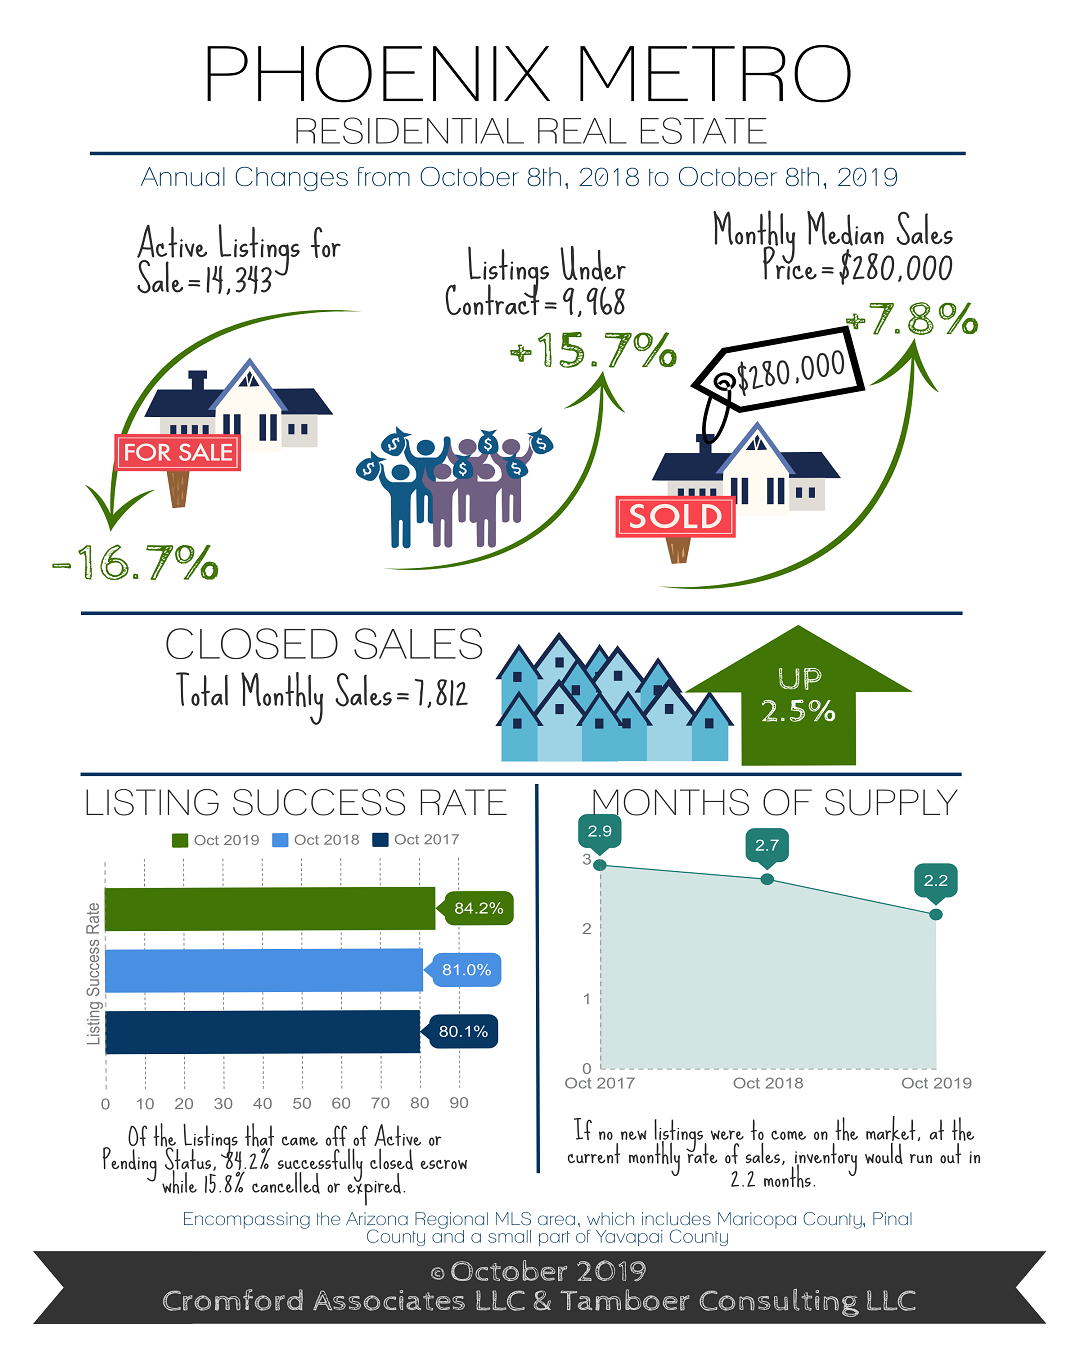
I understand many of the folks reading this post are not from Phoenix. You may find this interesting for now, then let’s revisit in a year and compare. Just sayin.

For Buyers:
The news media is filled with short-term predictions regarding the economy and how it will, or will not, affect real estate prices.  It’s understandable for buyers to want their home to appreciate in value after they purchase, who doesn’t?  However, there is far too much attention paid to short-term influences and fluctuations these days and not enough attention paid to the long view.  Real estate is a long-term investment for many people.  Despite the euphoria of 2005-2007 and the nightmare of 2008-2011, on average homes are selling 81.6% higher today than they were in the year 2000.  That’s an average appreciation rate of 4.3% per year over the course of 19 years.  Smaller homes appreciated the most over time while larger homes appreciated the least.  Homes under 1,000sf have appreciated 122% since 2000, an average of 6.4% per year.  Those between 1,000-2,000sf appreciated 106%, an average of 5.6% per year.  2,000-3,000sf appreciated 68% at 3.6% per year.  3,000-4,000sf appreciated 49% at 2.6% per year and homes over 4,000sf appreciated 11% at 0.6% per year.

For Sellers:
Average asking prices per square foot are up 9% over this time last year and they’re continuing to rise. However, not one individual price range has risen 9% or more; confusing, right? That’s because the sharp increase in the average has more to do with a growing market share of luxury active listings over $500K as inventory has plummeted everywhere else. The highest increase is within $200K-$250K, where sellers are asking 5.6% more than they were last year. That’s followed by listings over $1M where they’re asking 4.2% more and $500K-$1M at 4.0%.  All other price ranges are just 1-3% higher.  But are buyers paying?  Actually, many of them are! In the $200K-$250K range, the average sales price per square foot is still 0.8% higher than the average list price; and between $250-$300K the average sales price is 6.8% higher than the average list per square foot. Things change over $500K.  Between $500K-$1M there’s a -6.3% gap between asking price and sales price and over $1M the average sales price is -15.1% below the average asking price.


Commentary written by Tina Tamboer, Senior Housing Analyst with The Cromford Report ©2019 Cromford Associates LLC and Tamboer Consulting LLC

Filed Under: AZREIA, Business Acquisition, Capstone Capital USA, Case Shiller Home Price Index, CashFlow, Dave Franecki, EddieSpeed, Fair Market Value, Featured, Financial Freedom, Fix & Flip, How To Grow An IRA With Notes, How to Grow an IRA with Notes, How to Sell My Mortgage Note, Interest Rate Trends, Note Investing, Note Investor Forum, Note Investors Forum, Note ROI, Partials, PHOENIX FIX & FLIP, PHOENIX MORTGAGE NOTES, PHOENIX REAL ESTATE, PHOENIX REAL ESTATE CLUB, Protecting Mortgage Note Values, Real Estate Trends, Rental Real Estate, RentalRealEstate, REO, Return on Investments, Roth IRA, Safe Note Investing, SDIRA, Self Directed IRA, SELLER CARRY BACK, Seller Financing, Seller Financing Tips, Seller-Carry., Traditional Banking Tagged With: #NoteInvesting #NoteBuyers #SDIRA #RENotes #REOs #PerformingNotes #NonPerformingNotes, #SDIRA, #SellerCarry, #SellerCarryBack, #SellerFinancing, Arizona note buyer, AZREIA, Barney Frank, Business Notes, CAPSTONE CAPITAL USA, CFPB, Chris Dodd, Colonial Funding Group, Contract For Deed, Dave Franecki, Diversified Investments, Dodd-Frank Act, eddie speed, Education IRA, EQUITY TRUST, Financial Freedom, Financing a Business Sale, Heritage Capital USA, Interest Rates, Land Contract, MailBox Money, Manufactured Housing Financing, mortgage note, mortgage note payment histories, mortgage note payments, mortgage note risks, Mortgage Note Servicing, NonPerforming Notes, Note Buyer, Note Buying, Note Due Diligence, note investing, Note Investors Forum, Note Nation, Note Partials, Notes Direct, Notes Made Simple, NOTESCHOOL, NoteWorthy Investor Summit, Paper Source, partial mortgage note, Passive Income, Performing Note For Sale, Performing Notes, Phoenix Housing Market, Phoenix NotePro, Phoenix Real Estate, Phoenix Real Estate Club, private mortgage note, promissory note, QUEST IRA, Real Estate, Real Estate Notes, ROTH IRA, SCOTT CARSON, Self Directed IRA, sell mortgage note, sell mortgage notes, sell my mortgage note, Sell TrustDeed, seller financed notes, seller financing mistakes, Seller FinancingTips, selling mortgage notes, Texas Real Estate Note, Texas Seller Financing Tips, Tracy Z Rewey, Wall Street Reformed Consumer Protection Act, Walter Wofford, We Buy Notes.com

109 E 17th St #63 Cheyenne, WY 82001 | (480)-232-5477